Feature engineering plays a crucial role in many data modeling tasks. It is simply a process that defines the important characteristics of the data by which a model can improve its performance. In time series modeling, feature engineering works differently because it is sequential data and it is trained using the changes of all values as a function of time. In this article, we are going to discuss feature engineering in time series and we will also cover an implementation of feature engineering in time series using a package called tsfresh. The main points to be discussed in the article are listed below.
Contents
- Feature Engineering in Time Series
- What is tsfresh?
- Implementing tsfresh for feature engineering
Let’s start by understanding what characterizes engineering in time series.
Feature Engineering in Time Series
In supervised learning, feature engineering aims to scale strong relationships between new input and output features. Speaking of time series modeling or sequential modeling, we are not feeding any input variable to the model or expecting any output variable (input and outputs are in the same variable). Since the characteristics of data and methods that we know about time series modeling work in a different nature. This data consists of time elements in the data with certain values that change with the time element.
By looking at this data, we can say that the characteristics of all time series data is time or the main characteristic that we use in modeling is time which is also responsible for predicting good results. In time series, we need to perform feature engineering with the time variable. For example, we may require engineering dates from the year we see our sales increase in value. Time series data is created using the independent variable where time is the most common variable. The image below can be an example of a time series chart.
Picture The source
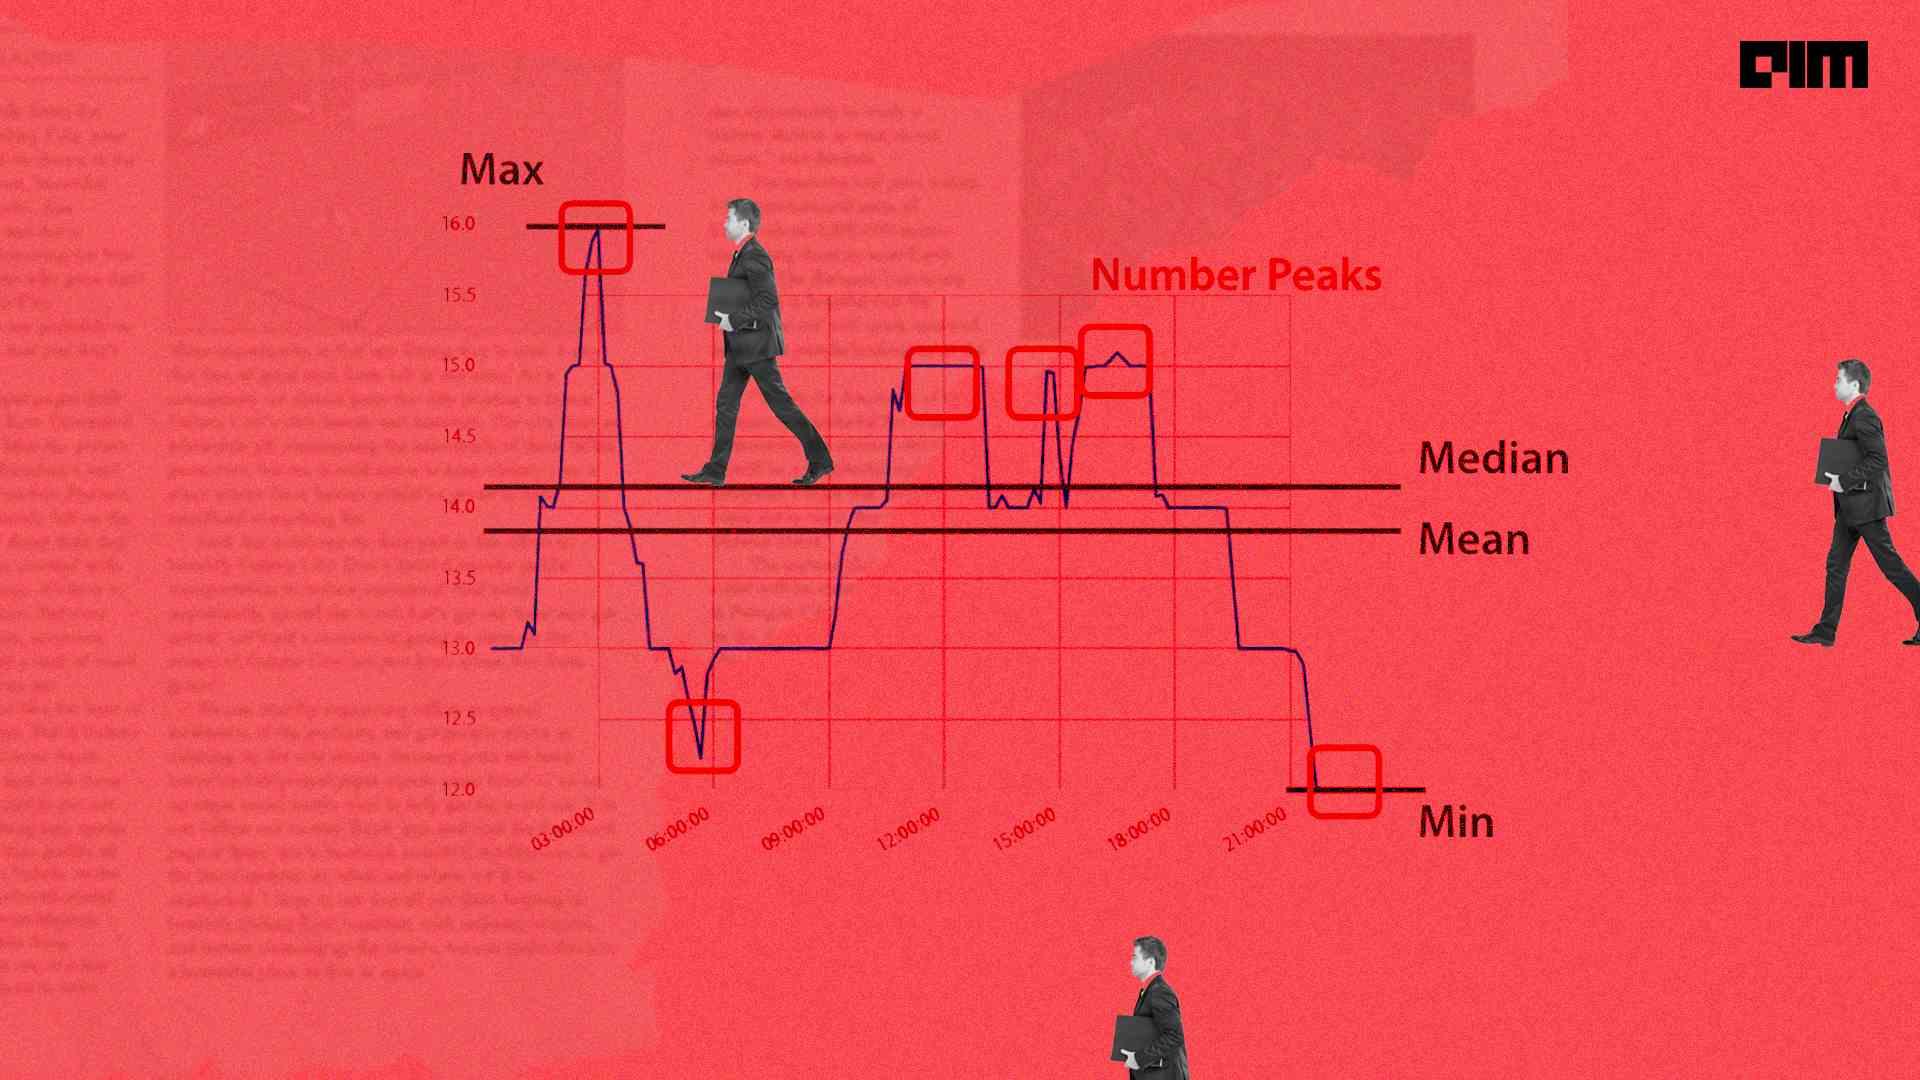
In the graph we can see that we have changed the values over time. We may want to find some of the characteristics from this data. Examples of characteristics can be the maximum or minimum value, the average value or a temporary peak in the data. Take an example from the image below.

Here we can see how the feature can consist of time series data. We can perform time series feature engineering using the tsfresh package. Let’s understand what tsfresh is.
What is tsfresh?
tsfresh is an open-source python package that can help us with time series data feature engineering. As already mentioned, time series is sequential data, so this package can also be used with any type of sequential data. One thing that is mandatory regarding the data it should have generated using an independent variable. For example, in time series data, we find that the time variable is an independent variable.
By using this tool we can extract features and we can perform analysis based on the new information. Feature extraction is also useful for creating clusters from the time series or we can also perform classification and regression tasks using feature extraction.
Another thing that can be very useful for us in this package is that it is compatible with pandas library for data manipulation and it is also compatible with sklearn library which helps us to provide various machine learning models. Let’s see how this package can be used.
Implementation
We can install this package using the following lines of code:
!pip install tsfresh
After installation, we are ready to use the package. To understand the nature of how tsfresh works, we will perform a classification task using the dataset provided by tsfresh which contains information about the failure of the robot. In the data, we see that each robot collected time series from different sensors. Let’s load the data.
from tsfresh.examples.robot_execution_failures import download_robot_execution_failures,
    load_robot_execution_failures
download_robot_execution_failures()
Define x and y
x, y = load_robot_execution_failures()
Here we have data features in instance x and the target feature is in instance y.
x.head()
Exit:

y.head()
Exit:

In the head of x we can see that we have 6 columns in the data name like F_x, F_y, F_z, T_x, T_y, T_z are the time series and the id column gives the different robots. Let’s visualize some of the data using matplotlib.
import matplotlib.pyplot as plt
x[x['id'] == 4].plot(subplots=True, sharex=True, figsize=(12,12))
plt.show()
Exit:

In the output above we can see the time series for sample ID 4 which represents no failures. Let’s check another sample.
x[x['id'] == 14].plot(subplots=True, sharex=True, figsize=(12,12))
plt.show()
Exit:

Here we can see that we have some failures. Let’s check if our model can capture these details or not.
Feature Extraction
from tsfresh import extract_features
features = extract_features(x, column_id="id", column_sort="time")
Exit:

Here, the process of feature extraction from time series is complete. Let’s see how many features we have from these different time series.
features
Exit:

Here we can see 88 rows and 4734 columns in the extracted features. There may be many non-values in the extracted features which can be removed using the following lines of codes.
from tsfresh.utilities.dataframe_functions import impute
impute(features)
We can now select the relevant features using the following lines of codes.
from tsfresh import select_features
filtered_features = select_features(features, y)
filtered_features
Exit:
In the above output, we can see that there are only 682 columns presented after feature filtering. Here, we did two things with the data: first, we extracted features from the data, and second, we filtered the extracted features.
We can now compare the results of any sklearn model using the data with all features and the data with filtered features. Let’s separate the data into tests and practice.
from sklearn.model_selection import train_test_split
X_feature_train, X_feature_test, y_train, y_test = train_test_split(features, y, test_size=.4)
X_filtered_train, X_filtered_test = X_feature_train[filtered_features.columns], X_feature_test[filtered_features.columns]
Let’s fit the data with all features in a decision tree model.
from sklearn.tree import DecisionTreeClassifier
from sklearn.metrics import classification_report
classifier_feature = DecisionTreeClassifier()
classifier_feature.fit(X_feature_train, y_train)
print(classification_report(y_test, classifier_feature.predict(X_feature_test)))
Exit:
Here we have good results with all features. Let’s check a model using data that has been filtered.
classifier_filtered = DecisionTreeClassifier()
classifier_filtered.fit(X_filtered_train, y_train)
print(classification_report(y_test, classifier_filtered.predict(X_filtered_test)))
Exit:
Here we can see that a similar model improved its performance with the filtered model.
Last words
Here in this article, we have discussed feature engineering in time series. Along with this, we discussed a python package named tsfresh, which can be used in time series feature engineering. Using some of the modules, we performed feature engineering and after feature engineering, we found some improvements in the performance of the model.
The references
Comments are closed.